
For Maths Talk, Team Tui did Probability with Moe and were wondering what is the probability of choosing a colour first. The most common was White and Blue at 25%. Least common was Brown and Red with 15%.
For Maths Talk, Team Tui did Probability with Moe and were wondering what is the probability of choosing a colour first. The most common was White and Blue at 25%. Least common was Brown and Red with 15%.
Task Description: RM12 were learning about Graphs for Statistical Learning in Maths. We all did a graph each in this slide, (First slide is an example.) Second is Moe’s, Third is Yavi’s and last is mine.
PS: MYS means, Moe, Yavi, Sadaw

Task Description: Yesterday, in Maths, Team Tui was learning about Pi. We did a small activity by measuring the Cylinder shapes with Pi.
How did we do it?
i. I measured the diameter using a Ruler.
ii. I measured the Circumference using a string.
iii. I divided the Circumference by the diameter.
iv. This result is called Pi.
v. The value is just over 3.
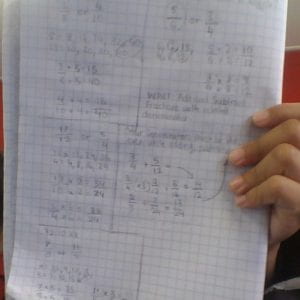
Task Description: For our Teacher Maths Session today we had to Add and Subtract Fractions with related Denominators. Moe and I learnt about adding fractions and a ton of Shortcuts which we are very proud of. Such as, finding out which fraction is bigger. We found a shortcut taught by Ms Fonua.
TASK DESCRIPTION: Team Tui was learning about Probability for Maths. There were 3 activities relating to Probability: Greedy Pig, Bottle Flip and Cards. In Greedy Pig all you had to do was to roll the dice and if you get a number you would write it down in the squares but if you get number 1 you’d have to restart. Once you reach the end you must calculate everything. In Bottle Flip we would flip a bottle and have 10 turns each. After you must see if you have flipped it right or dropped it. If you did it right you put a line in the Success and if you didn’t, you’d have to put a line in failure. After that we would have to calculate the probability. In Cards, there was a screen that gave us a list of a specific card and there would be random covered cards on the table. We would have to uncover and see if it was a failure or a success.
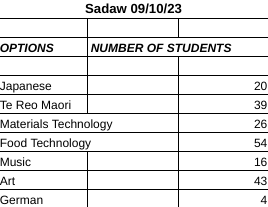
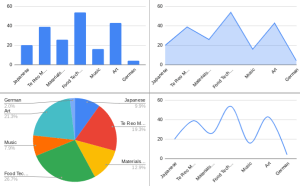
Task Description: Today, L4 groups in Team TUI worked on Statistical Maths. We had a look at Statistical Graphs, such as, Pie Graphs, Line Graph, Bar Graphs, etc.
Task Description: How do we figure out this equation?
Then you can solve all the questions from (Year 6, U.6)
For Maths today, Most of Team Tui did IXL and learning about Protractors.
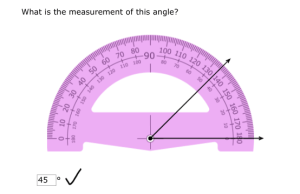
The correct answer here is 45° because you can start from either sides, (0° and 180°) So I counted, 0, 10, 20, 30, 40, and then 45° So I realised the answer was 45°. Sounds very simple so have a try!
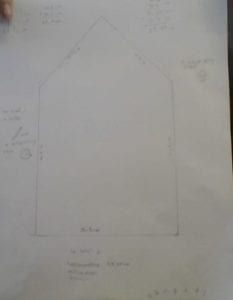
Task Description: Team Tui did some measuring maths today with any measuring items used to measure a shape by our choices. How did we work it out by centimetre? Here’s our strategy also shown on the paper.
9.13+9.13+14.3+14.3+13.5= 59.37 cm, how? Algorithm.
9.13 14.3 18.26
+ 9.13 + 14.3 + 28.6
——– ——– ———
18.26 cm 28.6 cm 46.32 cm
+ 13.5 cm
————-
59.37 cm
Millimetres: 593.7 mm
Centimetres: 59.37 cm
“yes, i know how to use a compass.”
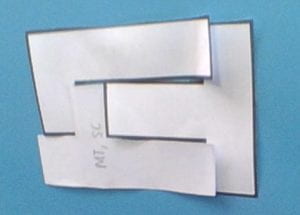
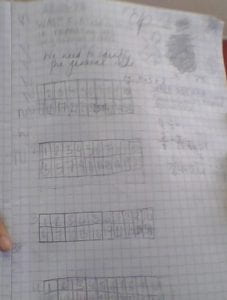
3 x 3 Pentominoes
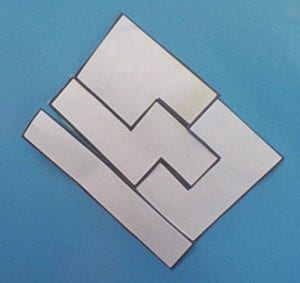
4 x 4 Pentominoes
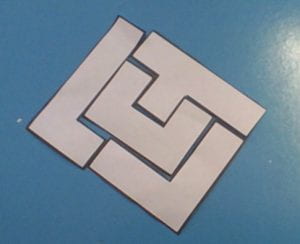
5 x 5 Pentominoes
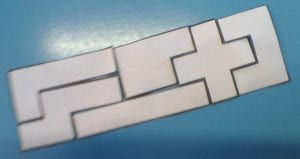
3 x 10 Pentominoes